WANDR Benchmark: Evaluating Research Agents That Must Search Wide and Deep
A benchmark for high-volume, evidence-heavy knowledge work

Today, we are releasing WANDR (Wide ANd Deep Research), an open benchmark and evaluation harness built around 500 realistic, challenging data-collection tasks for knowledge work. WANDR is the wide sibling of our DRACO benchmark for deep research. DRACO asks whether an agent can produce an accurate, complete, and objective long-form report; WANDR asks whether it can build a large collection and back up every member with specific evidence.
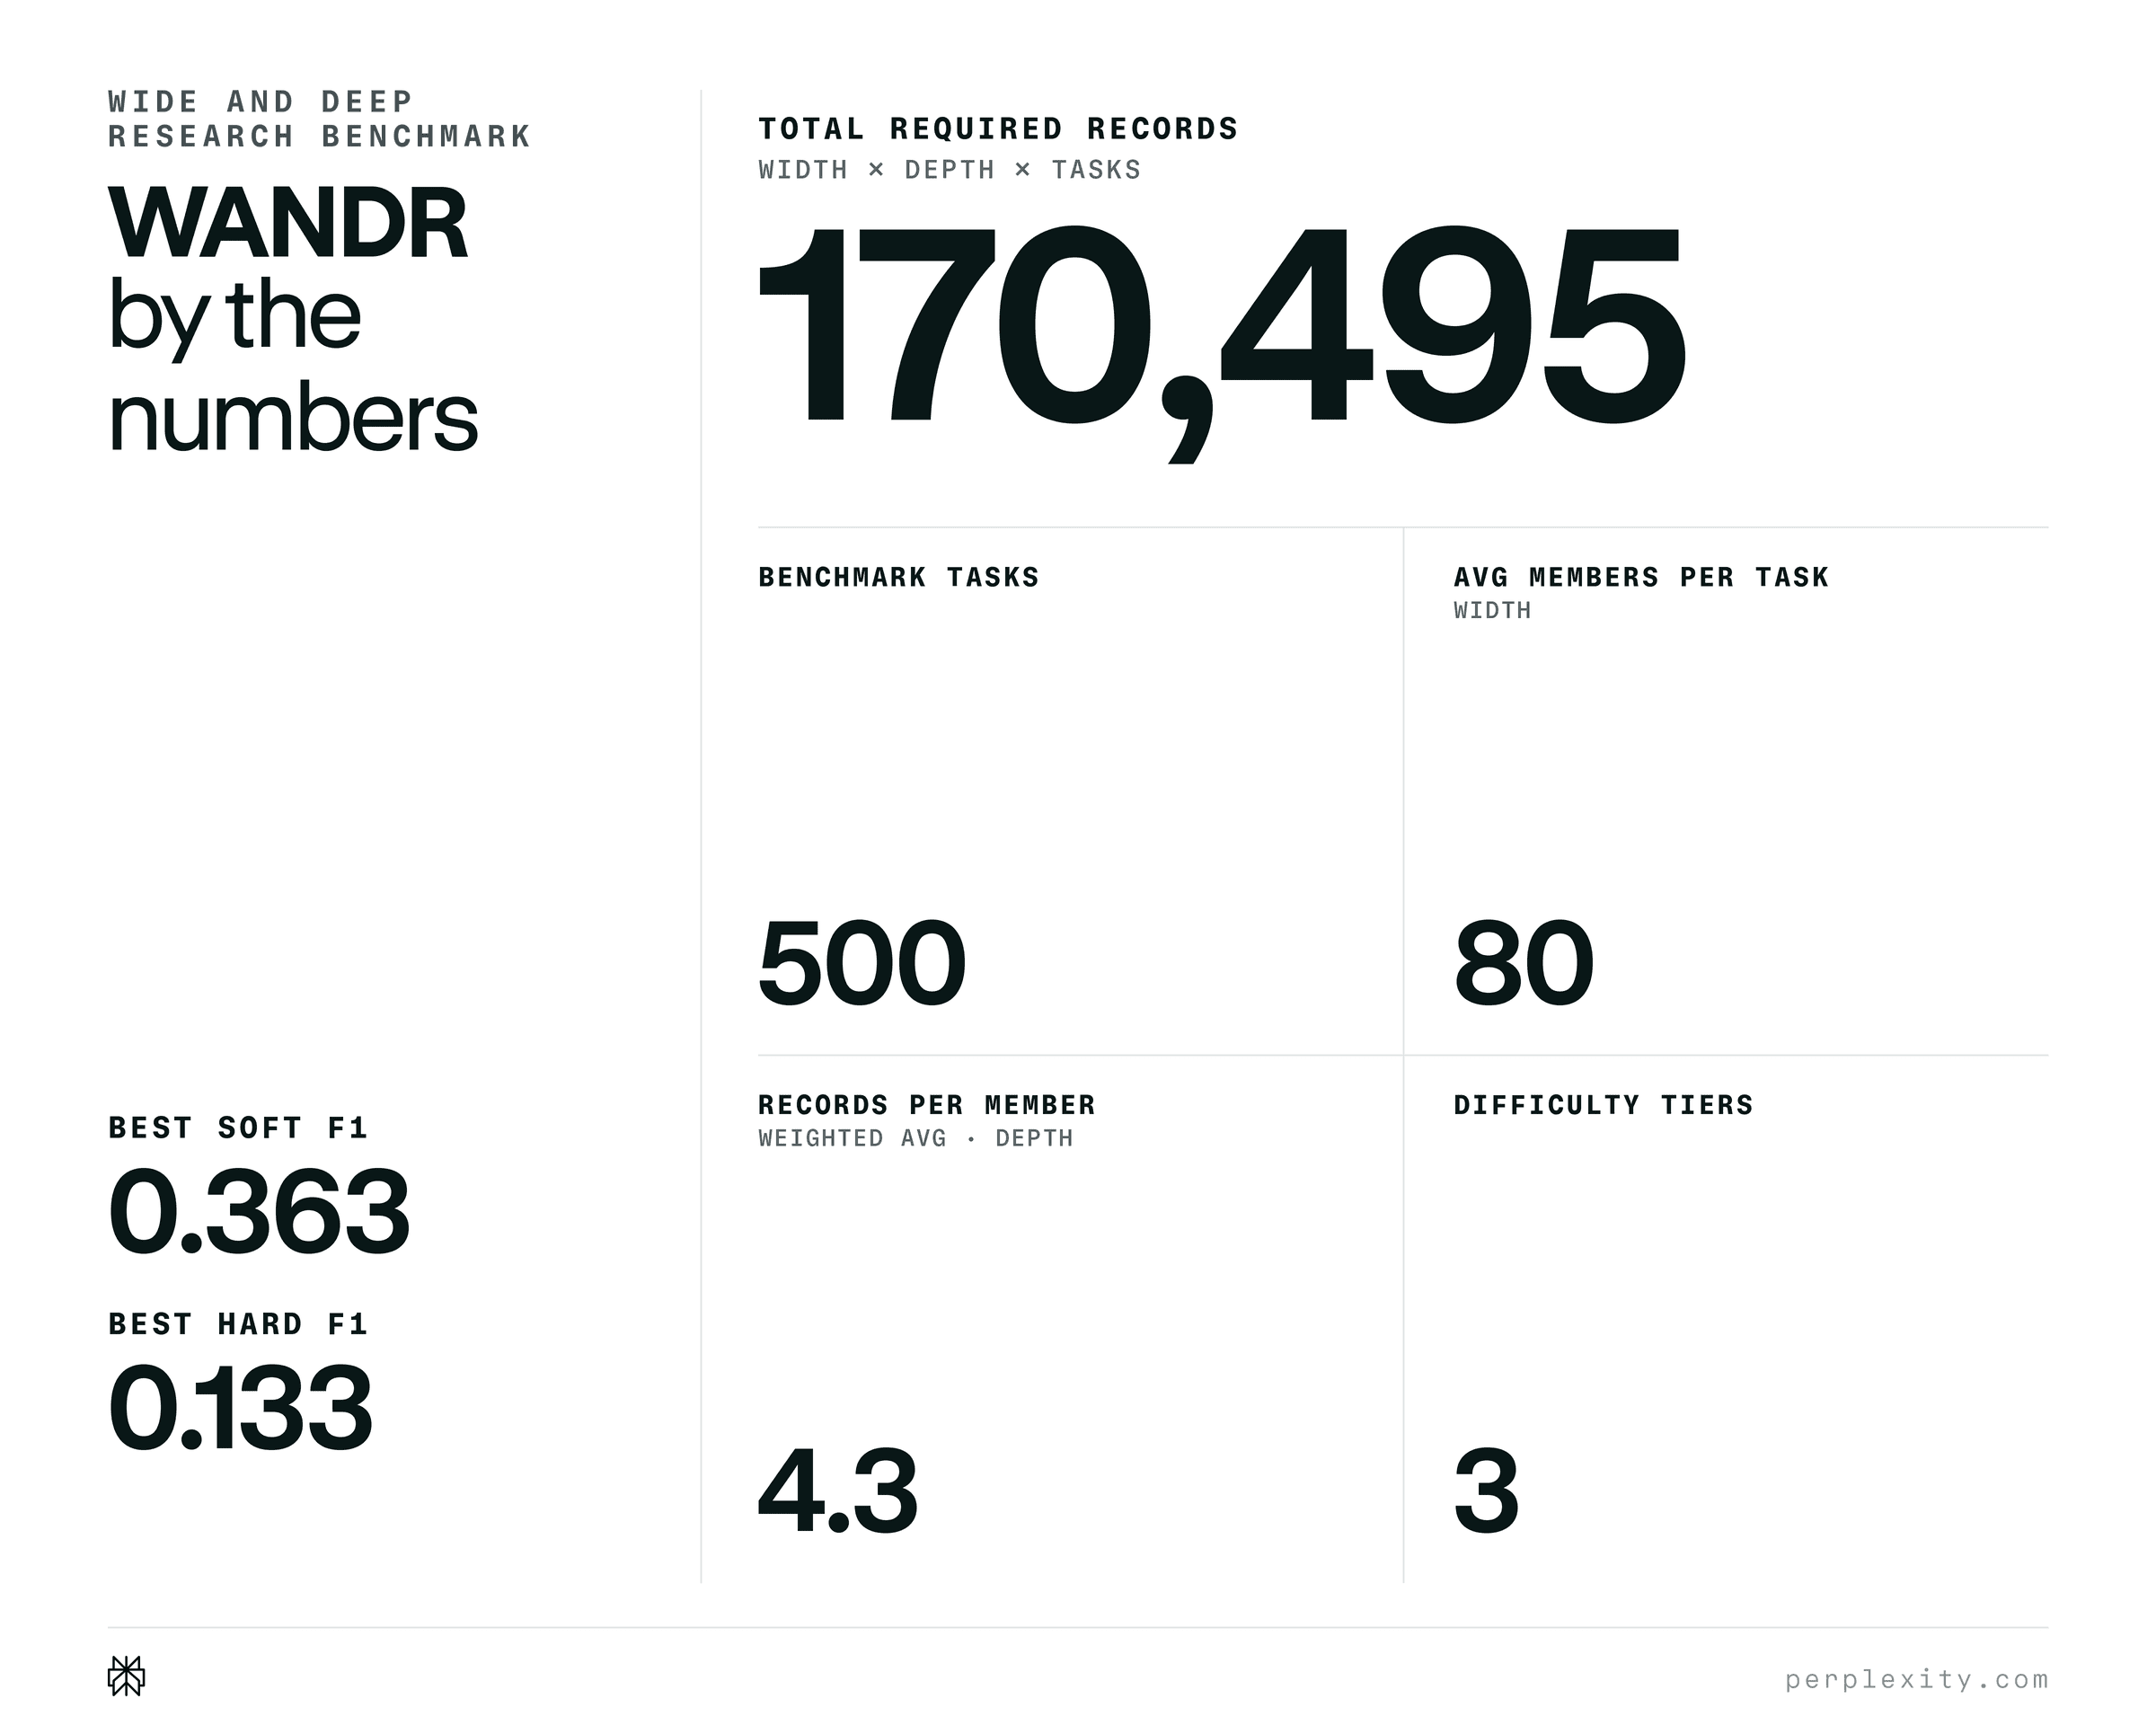
These are the kinds of jobs people already hand to research agents: competitive mapping, due diligence, literature review, market analysis, product comparison, talent sourcing, and more. The tasks range from dozens to thousands of independently verifiable records. Even at a high effort setting, the strongest system in our evaluation reaches just 0.363 soft F1 and 0.133 hard F1. Wide-and-deep research is still a long way from solved.
Why wide-and-deep research matters
Many useful research jobs do not end when an agent finds one answer. A market analyst may need every qualifying competitor, with the same evidence for each. A due-diligence team may need dozens of companies, then ownership, executives, financing, and regulatory status for every one of them. That creates two separate demands:
Wide: discover a large and often open-ended set of qualifying entities.
Deep: investigate every entity far enough to support each requested claim with evidence.
Combining the two changes the problem. A handful of compelling examples is not enough, and neither is a polished narrative built on incomplete research. The agent must sustain broad discovery without sacrificing factual quality from one record to the next.
WANDR captures that structure with a flexible, composable qualification key hierarchy. A task might ask for
company(n) → employee(m) → url(k)
This means finding n qualifying companies, m qualifying employees at each company, and k supporting pages for each employee. Every complete path through the tree can be validated independently. The same basic structure can represent a flat list, a nested search, a matrix, or a task with multiple evidence branches. These patterns can also be combined, allowing one representation to cover a broad range of real-world use cases.
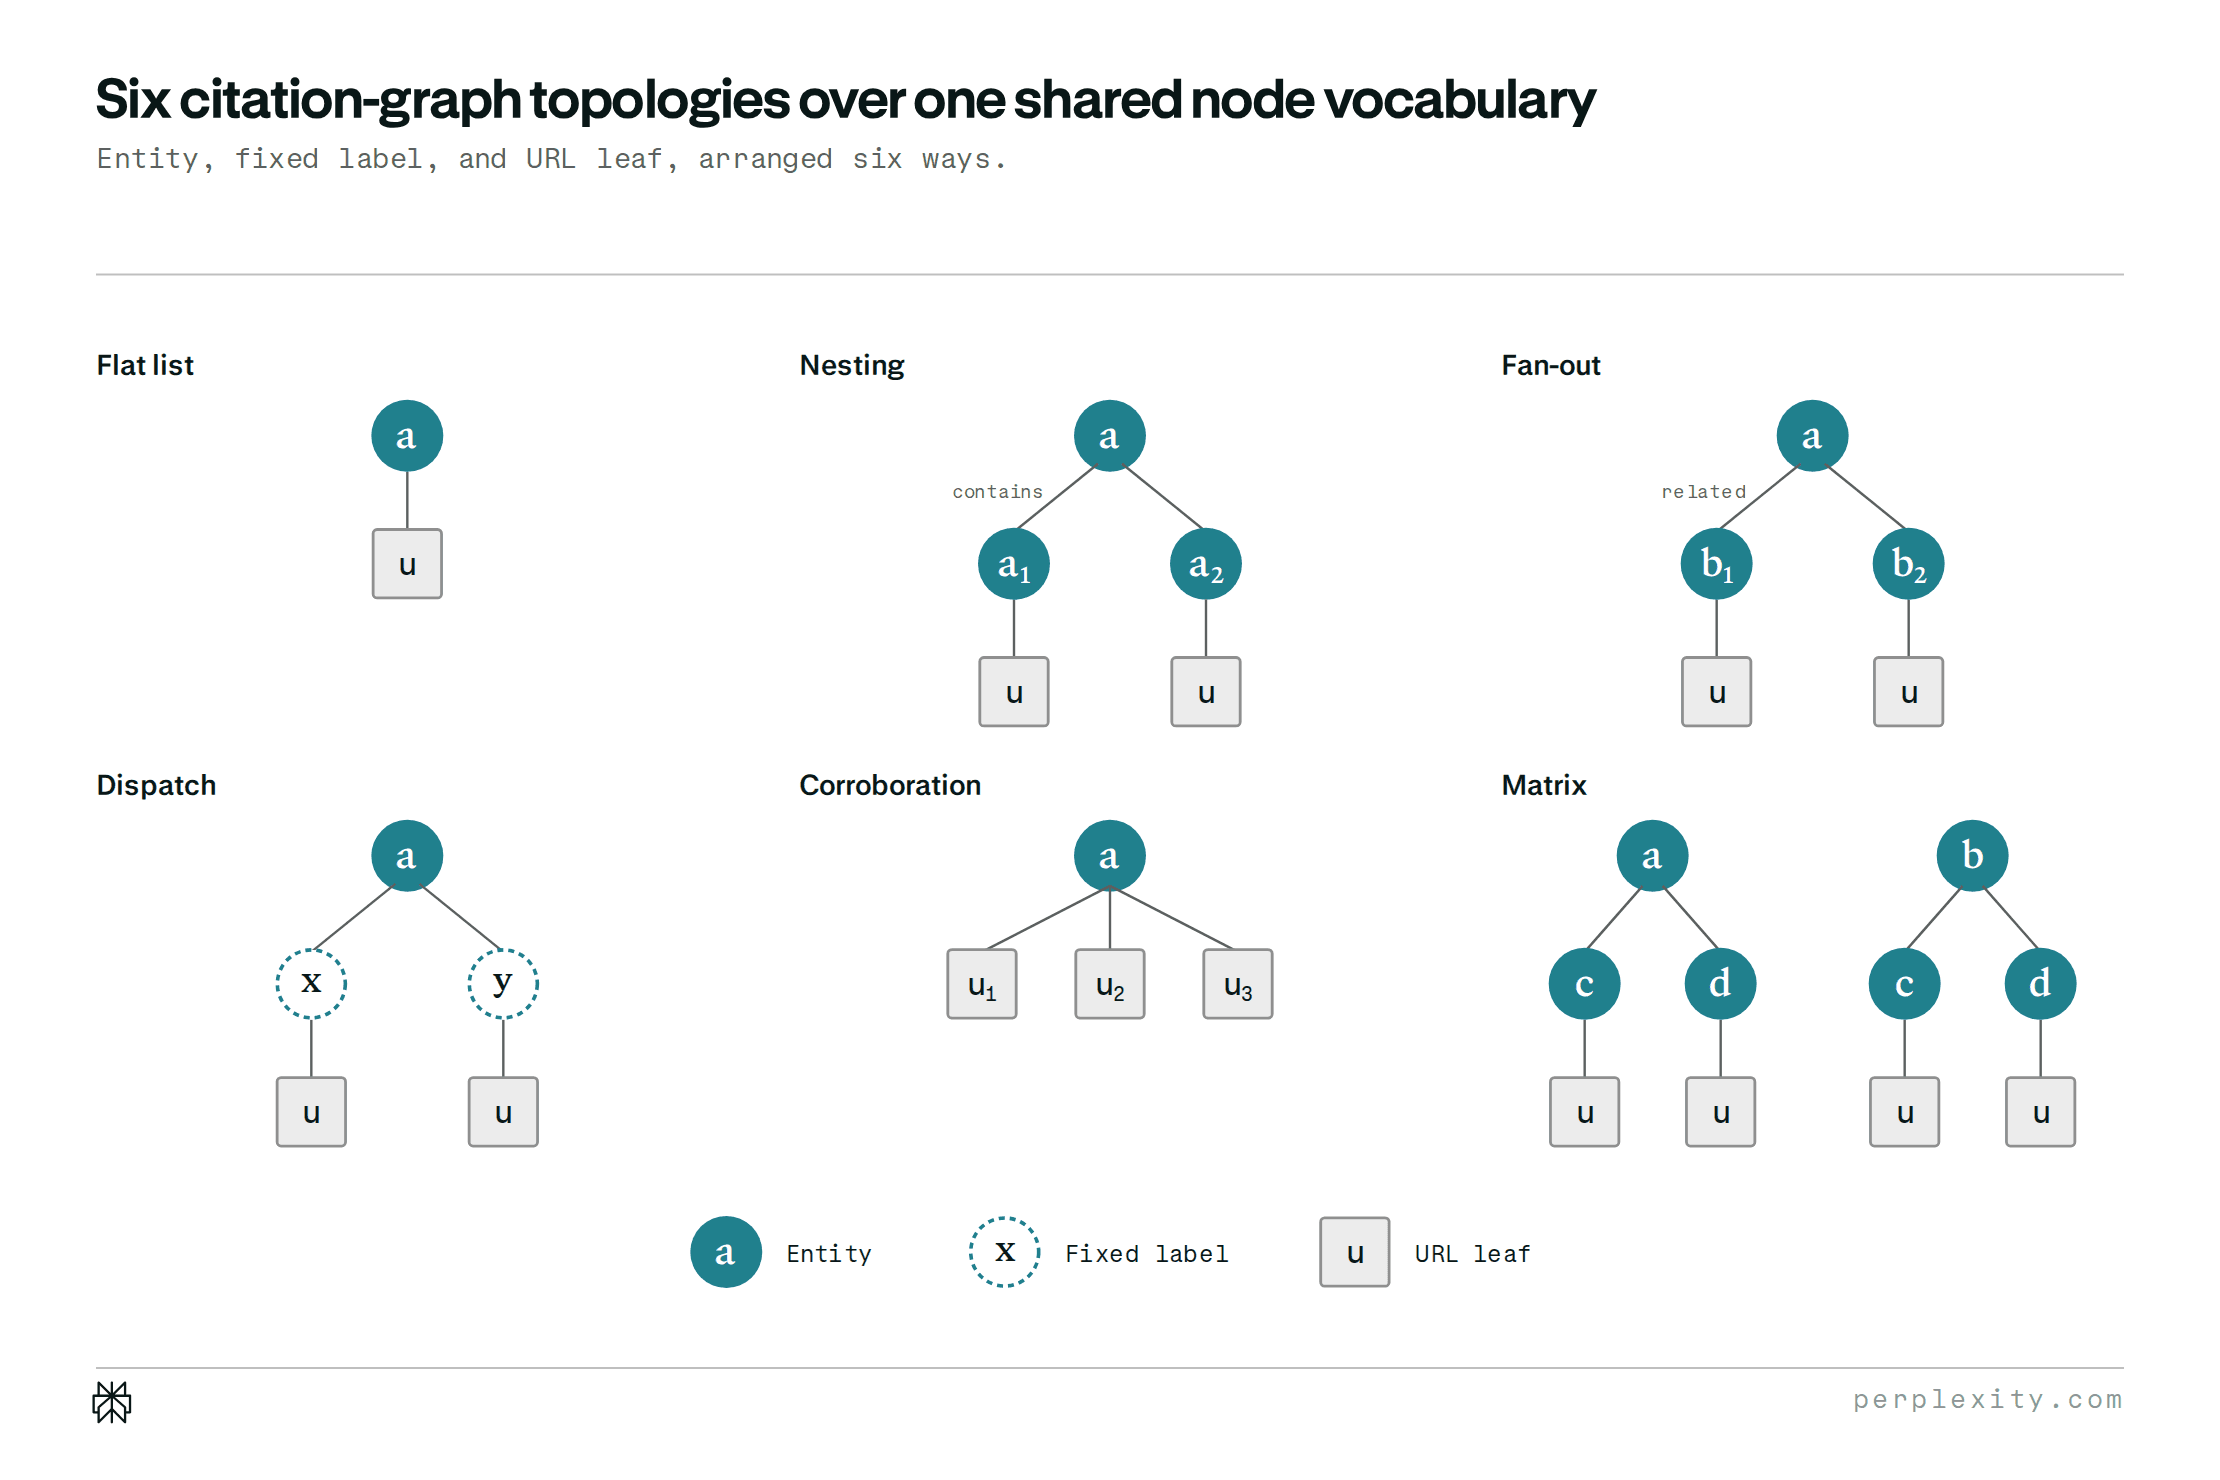
Six common hierarchy patterns. Filled circles are entities, dashed circles are fixed labels, and squares are URL leaves. In the matrix, repeated child labels denote the same child values under different parents.
One released task illustrates this structure in practice.
ceo_cfo_appointmentsPrimary task. Find at least 70 US-based companies with a CEO or CFO appointment first announced between March 1 and April 30, 2026. For each company, provide an authoritative appointment page that identifies the company and appointee, establishes the role and announcement date, and comes from the issuer, a filing, a newswire, or directly attributed first-hand business journalism.
Primary hierarchy.
company(70) → company_appointee(1) → url(1).Company-listing subtask. For the same companies, provide a recognized listing-authority page showing either a listing on a US national securities exchange or status as a US-domiciled SEC Exchange Act reporting issuer.
Subtask hierarchy.
company(70) → url(1).Records required. 140: 70 appointment records plus 70 listing records.
Every path ends in a page and excerpts that the grader can recheck. The shared company key lines up the appointment and listing branches, so an appointment without separate proof of listing status still leaves that company incomplete.
Realistic tasks, generated at scale
WANDR starts from de-identified patterns observed in production usage rather than synthetic prompts. This keeps the benchmark close to the work people actually delegate: open-ended discovery, repeated enrichment, cross-source checks, and structured comparisons at professional scale. A semi-automated pipeline turns those patterns into tasks, reserving human effort for quality control instead of exhaustive answer annotation.
The pipeline has four stages. Seeding mines de-identified product requests for a reusable wide-research pattern. Authoring runs an interleaved author–critic loop: the agents sketch and stress-test the design, write the task specification and judge, create fixture records, and use a mechanical linter to keep everything aligned. Admission checks that the target volume is reachable by merging 10–12 authoring rollouts, audits the task-specific judge, and optionally adds human sign-off. Curation labels the admitted tasks and selects a balanced final set across topics, scale, topology, and difficulty.
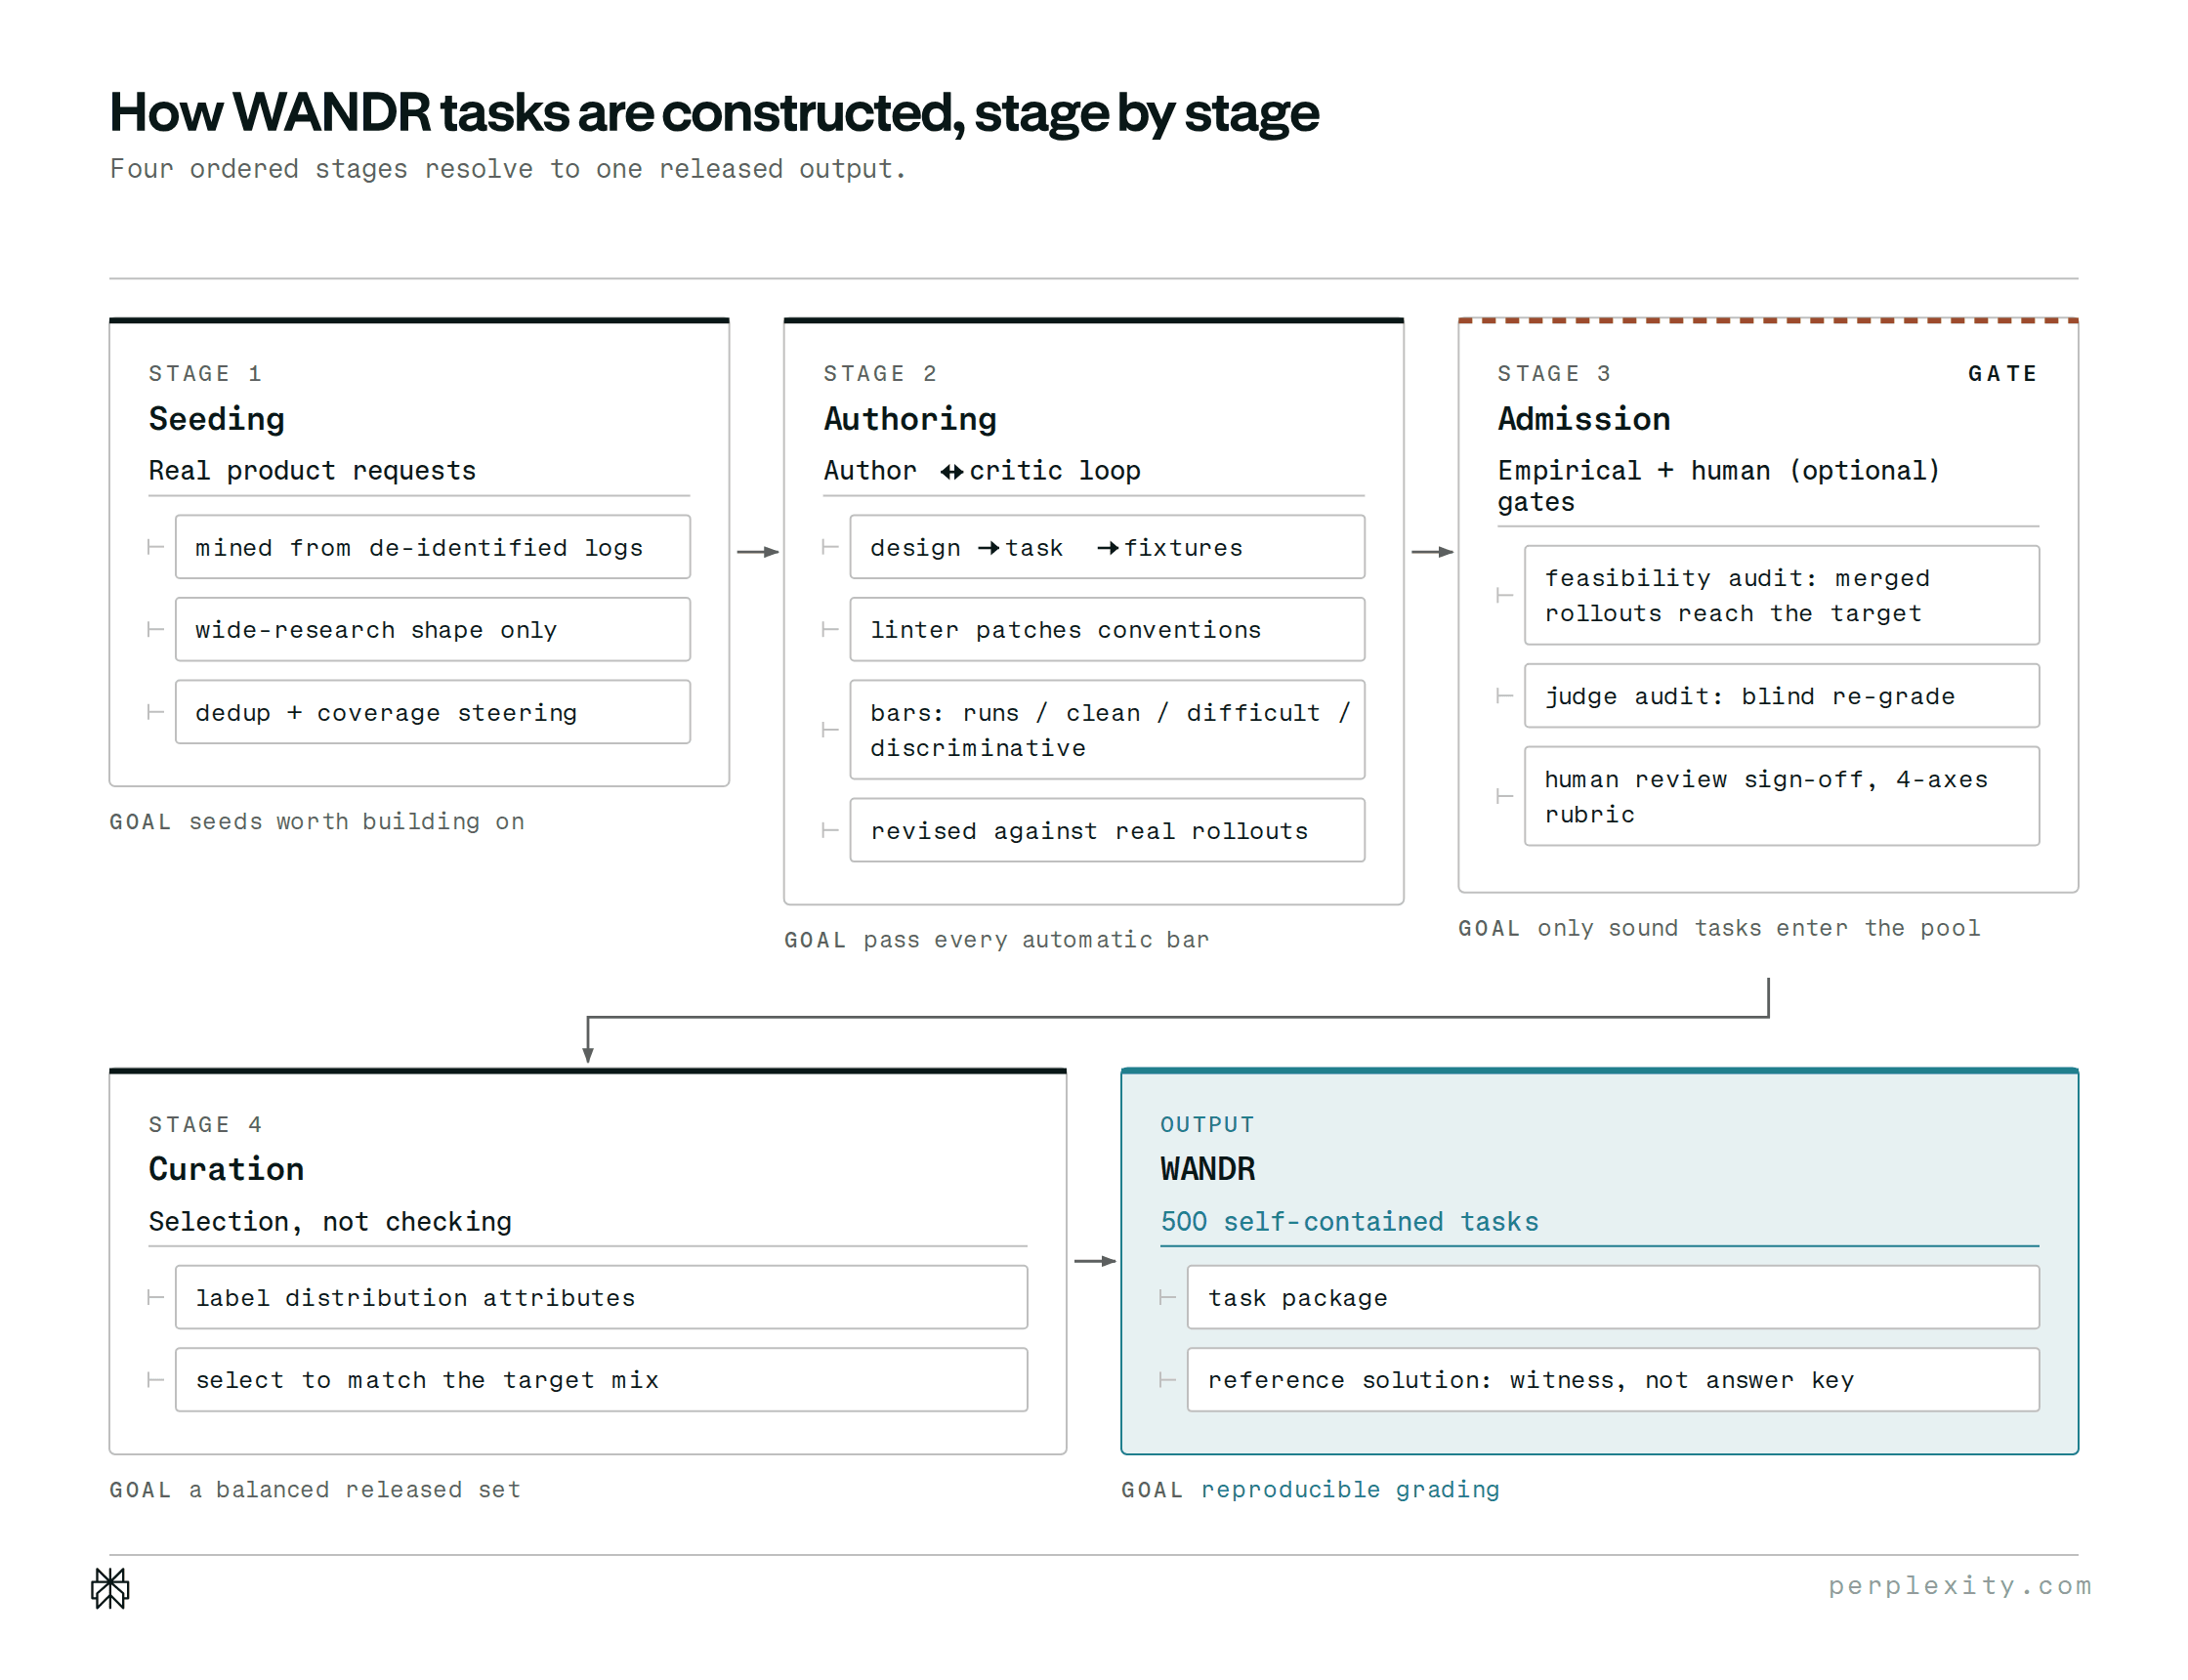
The task-construction pipeline has four stages. Seeding identifies a realistic request; authoring turns it into a self-contained task through an author–critic loop and mechanical checks; admission tests feasibility and judge quality; and curation selects a balanced release. The output is 500 public task packages.
The median task asks for 50 members, four records per member, and 245 records overall. Taken together, the 500 tasks call for 170,495 source-backed records. We calibrate difficulty from historical design-stage rollouts, then split the tasks by rank into 167 lower-, 166 middle-, and 167 higher-difficulty examples. The plot below shows that difficulty is not determined by scale alone; it also depends on the work required for each record.
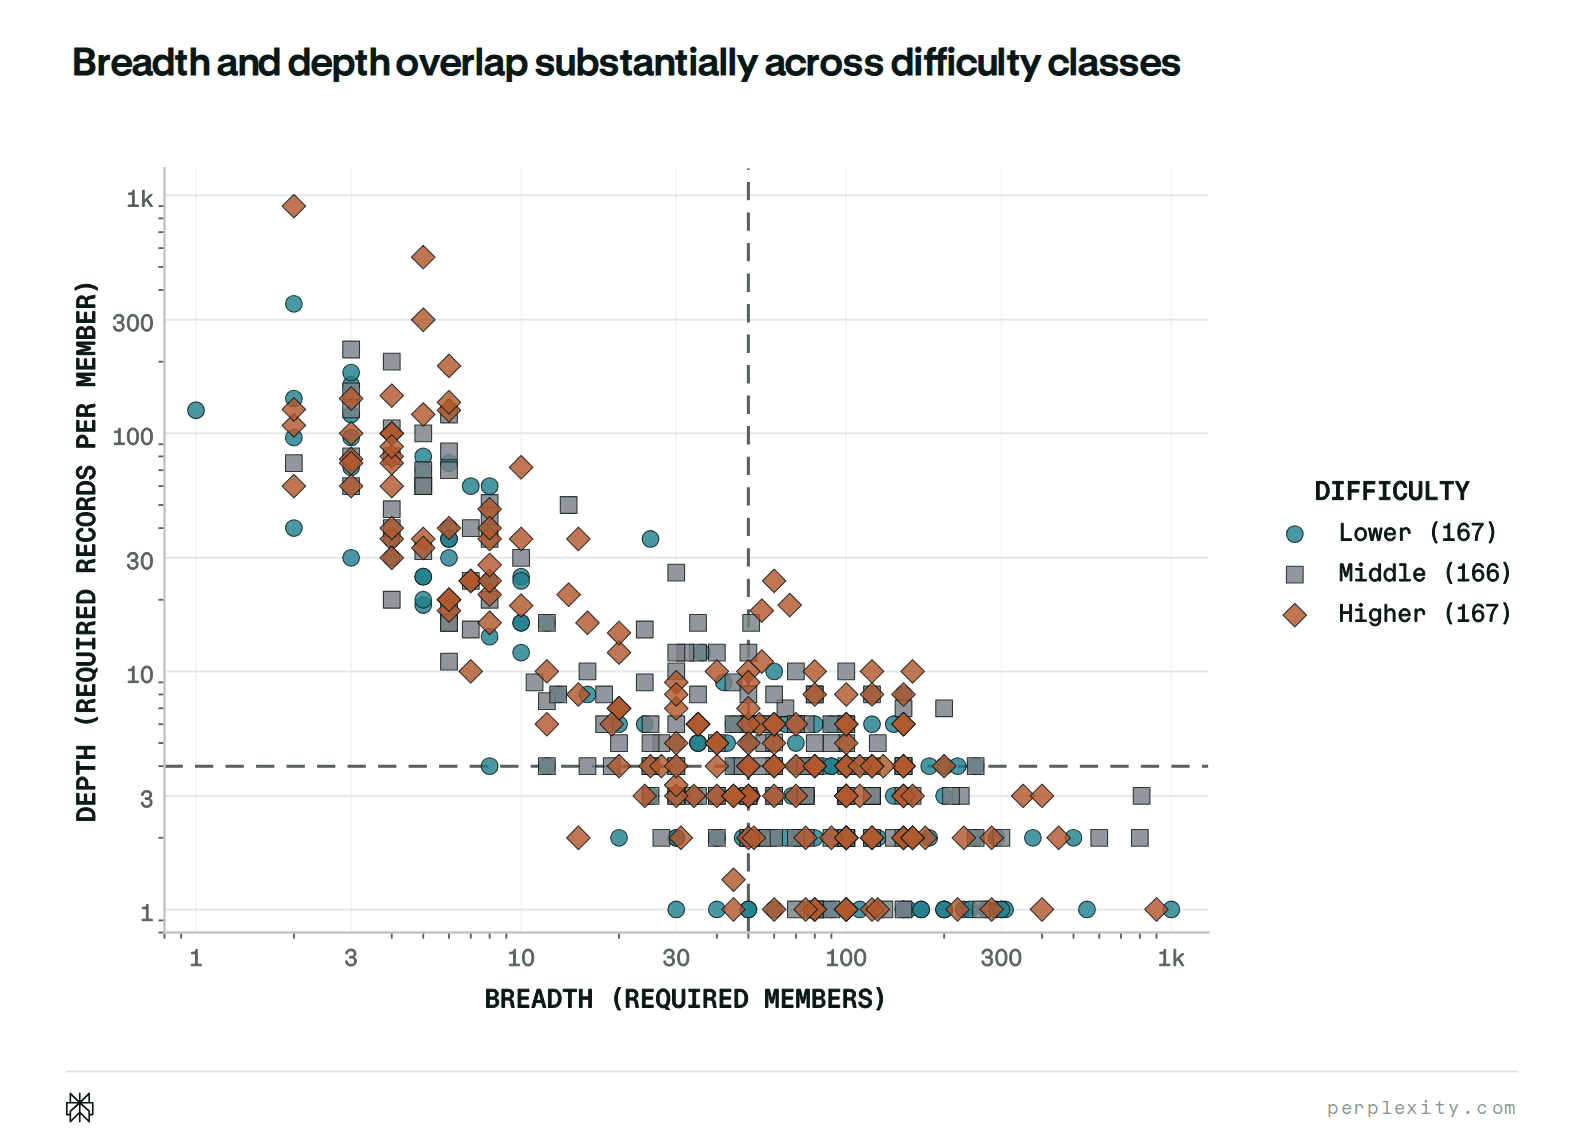
Overall task difficulty across the breadth–depth plane (log–log; 500 benchmark tasks). Breadth is the number of required members; depth is the required record count divided by that member count. Point color denotes the overall difficulty label. Dashed guides mark the median breadth (50 members) and median depth (4.00 records per member).
Reference-free, evidence-verified grading
A fixed answer key is a poor fit for open-ended research. It is expensive to build, quickly becomes stale, and poorly represents questions whose answers change over time. WANDR instead grades each submitted claim against the evidence the agent cites.
Every record contains an item, a URL, selected excerpts, and an answer. The grader re-fetches the page and checks whether it is usable, whether the claim is clear and in scope, whether the excerpts faithfully appear on the page, and whether both the page and excerpts support every requirement.
These binary record verdicts roll up through the hierarchy. Precision measures the quality of what the system submitted. Recall measures quality-adjusted completion against the requested volume, filling any shortfall with zeros. F1 balances the two. Soft scores give partial credit to incomplete members; hard scores count only members whose full required subtree is correct. For diagnosis, WANDR also reports a retrieval-only verdict that asks whether the fetched page satisfies the task before adding the stricter checks on validity and submitted excerpts.
This makes failures interpretable and localizable. High precision with low recall usually means the system found some good members but not enough of them. A large soft-to-hard drop means it made partial progress but rarely completed every branch needed for full credit. The score tree can localize the loss to discovery, enrichment, identity handling, page qualification, or evidence extraction.

The grading pipeline. Solve normalizes every system's output; fetch retrieves each cited page and retries broken fetches in a browser; judge resolves identities and evaluates every record; and score rolls the verdicts into task-level precision, recall, and F1.
What we found
We compared six production systems: hosted task and search APIs, general web-agent APIs, a deep-research product, and our programmatic search-orchestration system, Search as Code (SaC). Each one was scheduled on all 500 tasks under a pinned configuration, then went through the same fetch, judge, identity-resolution, and scoring pipeline.
Perplexity Search as Code leads at 0.363 soft F1 and 0.133 hard F1. Anthropic is second at 0.249 and 0.072; every other system tops out at 0.121 soft F1 and 0.035 hard F1. No system dominates both quality and efficiency. Perplexity sits in the middle of the cost range at $5.20 per task, with a 14.9-minute median solve time and 3.82 million reported tokens per task. OpenAI and Exa are faster and cheaper but score much lower. Anthropic comes closest on quality, but uses substantially more time, money, and tokens.
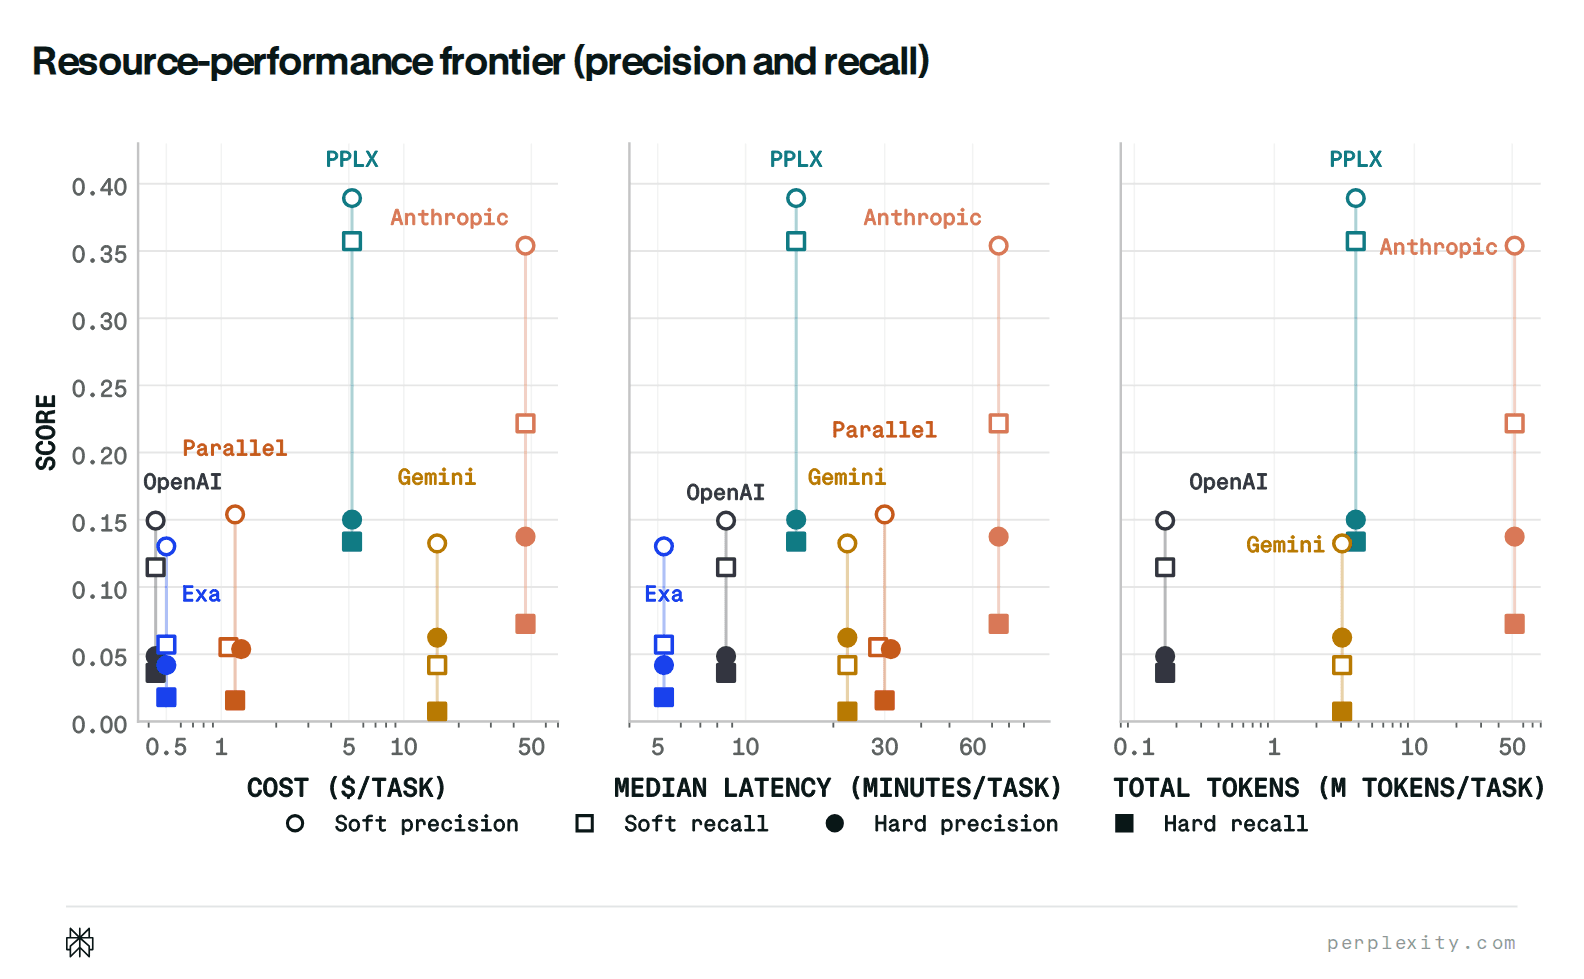
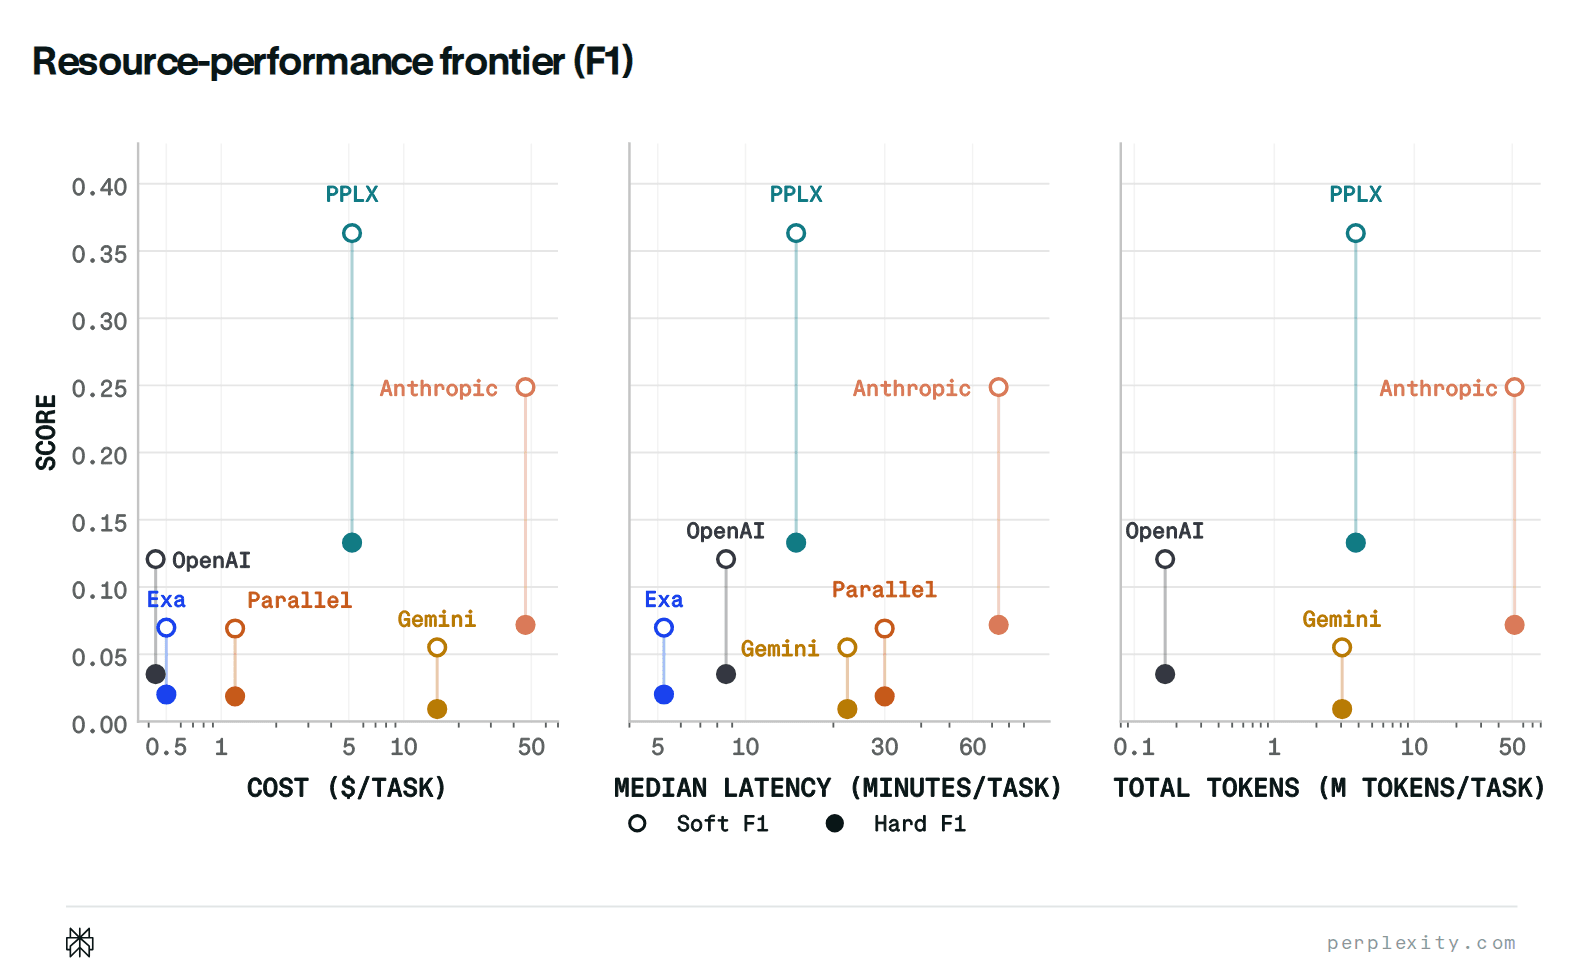
Soft and hard precision and recall (top), and soft and hard F1 (bottom), against cost, median solve latency, and reported token use. Higher and farther left is better. Exa and Parallel are absent from the token views because they do not expose token counts.
We also evaluated every available effort setting on the same 45-task subset. More effort improves Perplexity, Gemini, and Exa at every step; Perplexity reaches 0.447 soft F1 and 0.224 hard F1 at xhigh. Higher effort is not uniformly better, however: OpenAI peaks at high, and Parallel's hard F1 slips slightly between ultra2x and ultra4x. Cost spans more than four orders of magnitude, from $0.03 per task for Exa low to $324.83 for Gemini max.
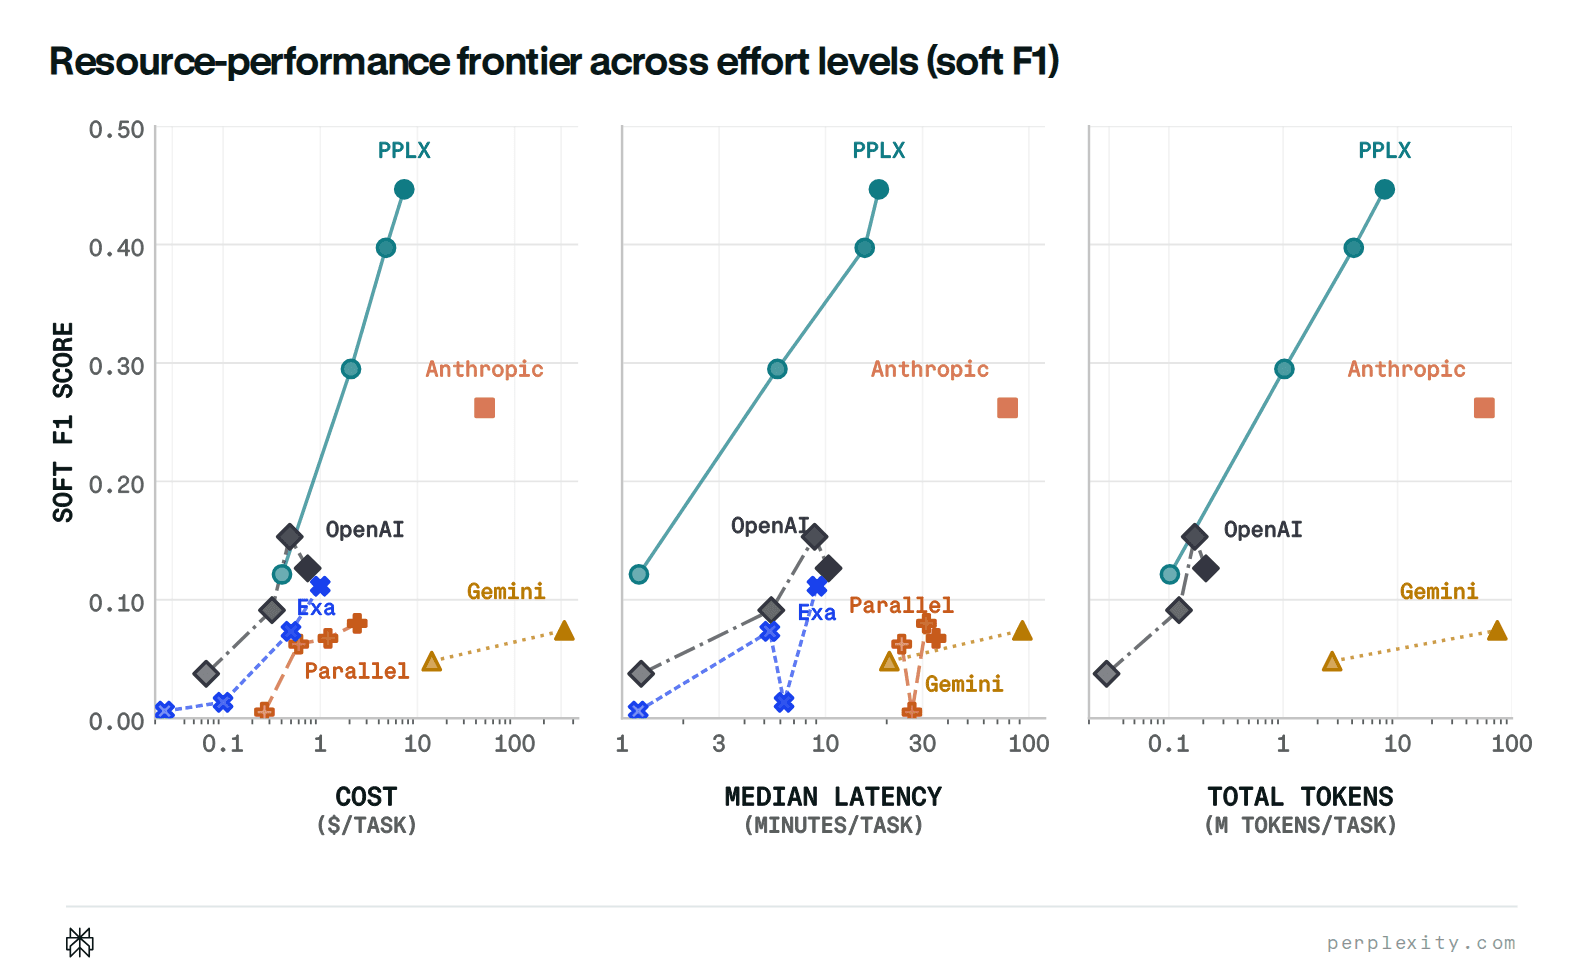
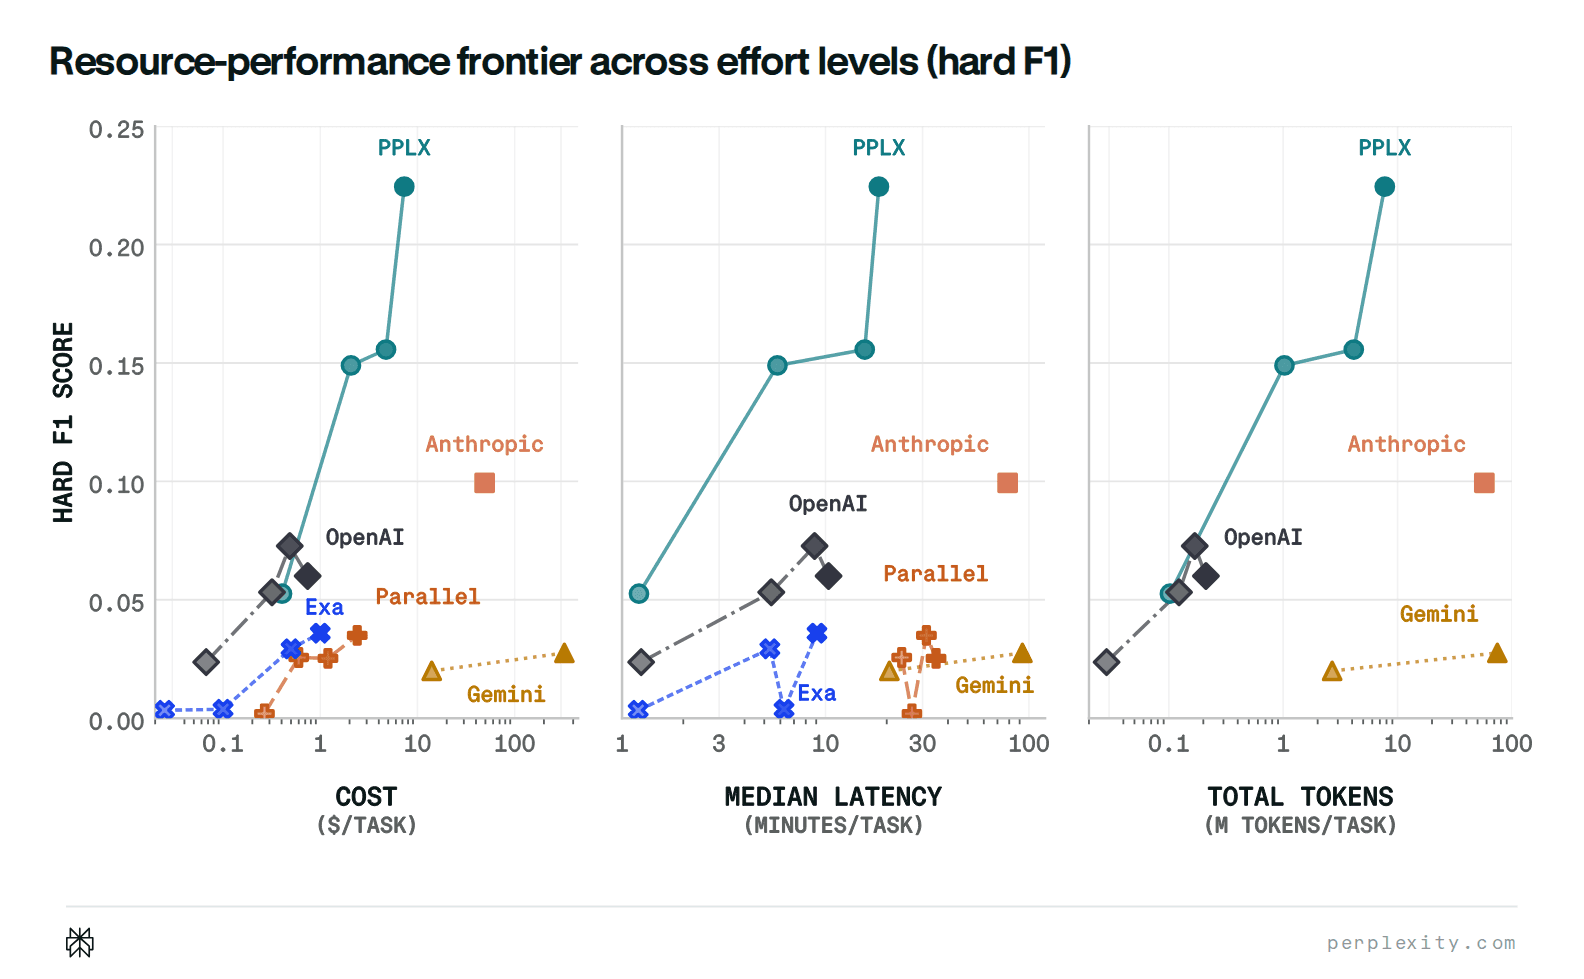
Soft F1 (top) and hard F1 (bottom) across all available effort settings on the matched 45-task subset. Darker paths denote higher effort.
Four findings stand out.
Partial progress is common; complete coverage is not. Soft recall is below soft precision for every system, which means performance falls once the full requested volume enters the denominator. Perplexity retains 0.357 recall from 0.389 precision, the smallest gap; Anthropic falls from 0.354 to 0.222. The soft-to-hard conversion is harsher still. Perplexity drops from 0.363 soft F1 to 0.133 hard F1, and Anthropic from 0.249 to 0.072. The best hard precision is 0.150 and the best hard recall is 0.134: even the leader earns full credit for only about one in seven members it submits and one in seven members the task asks for.
Scale compounds the problem. From the smallest to largest target-volume bin, Perplexity's hard precision drops from 0.235 to 0.096 and its hard recall from 0.219 to 0.079. Anthropic falls from 0.205 to 0.113 and from 0.127 to 0.042; OpenAI falls from 0.109 to 0.034 and from 0.102 to 0.016. Recall usually falls faster than precision: a system may keep a small pocket of complete members while covering less and less of the requested set.
Deeper hierarchies are harsher still. Going from no intermediate key to three or more, Perplexity's hard precision falls from 0.392 to 0.019 and hard recall from 0.378 to 0.017; Anthropic falls from 0.311 to 0.049 and from 0.229 to 0.022; OpenAI falls from 0.136 to 0.012 and from 0.120 to 0.011. Every added branch creates another place where a member can miss the all-or-nothing hard score. Cost and latency do not follow a common monotonic pattern.
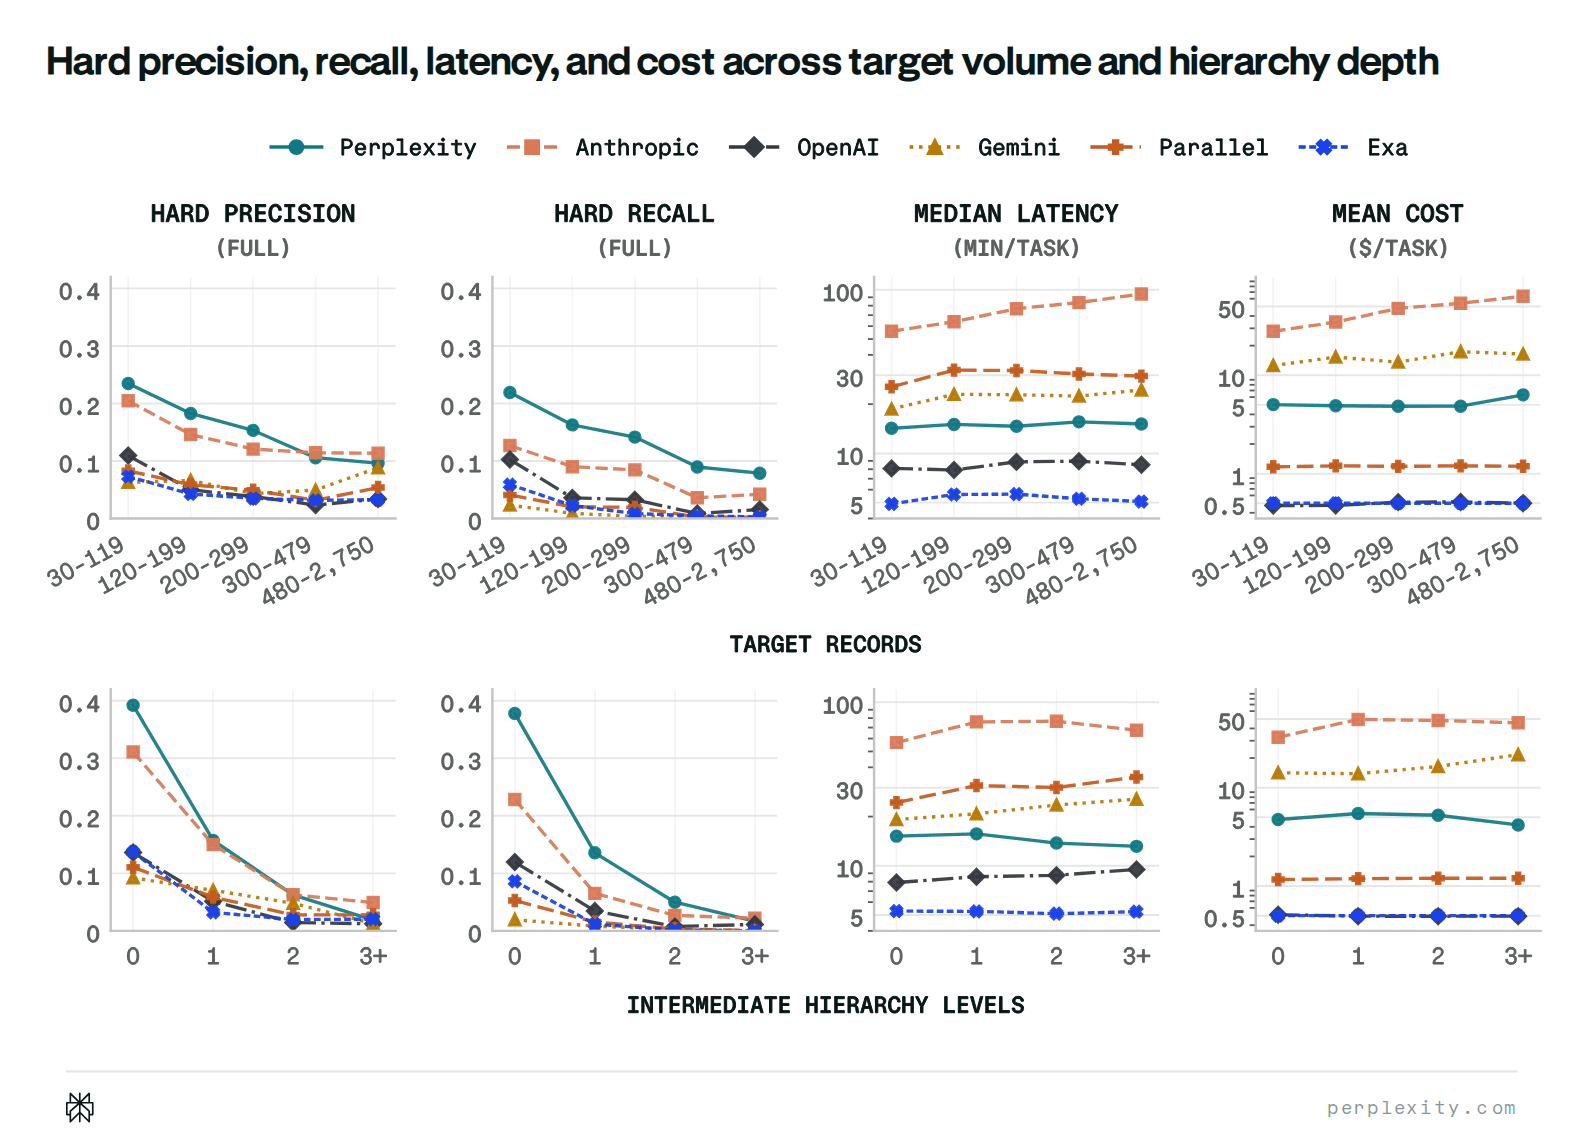
Hard precision, hard recall, median solve latency, and mean cost across target record volume (top) and intermediate hierarchy depth (bottom). Each line represents one fixed main-run configuration. Lines connect task-bin aggregates for readability and do not imply a causal effect of scale or structure.
Even before judging quality, discovery is the first structural bottleneck. Looking only at raw, pre-collapse counts, mean top-level discovery completion ranges from 0.611 to 0.951. Conditional enrichment is stronger at 0.767–0.967, and terminal evidence-slot completion reaches 0.979–0.994 once a member and its enrichment path exist. Perplexity leads discovery at 0.951 and enrichment at 0.967, but OpenAI is slightly higher on terminal evidence slots at 0.994 versus 0.991. Duplicate collapse accounts for only 0.017–0.205 percentage points of count loss across the six full runs, so under-delivery, not identity merging, is the main aggregate explanation. The largest raw structural losses occur before the final URL is attached.
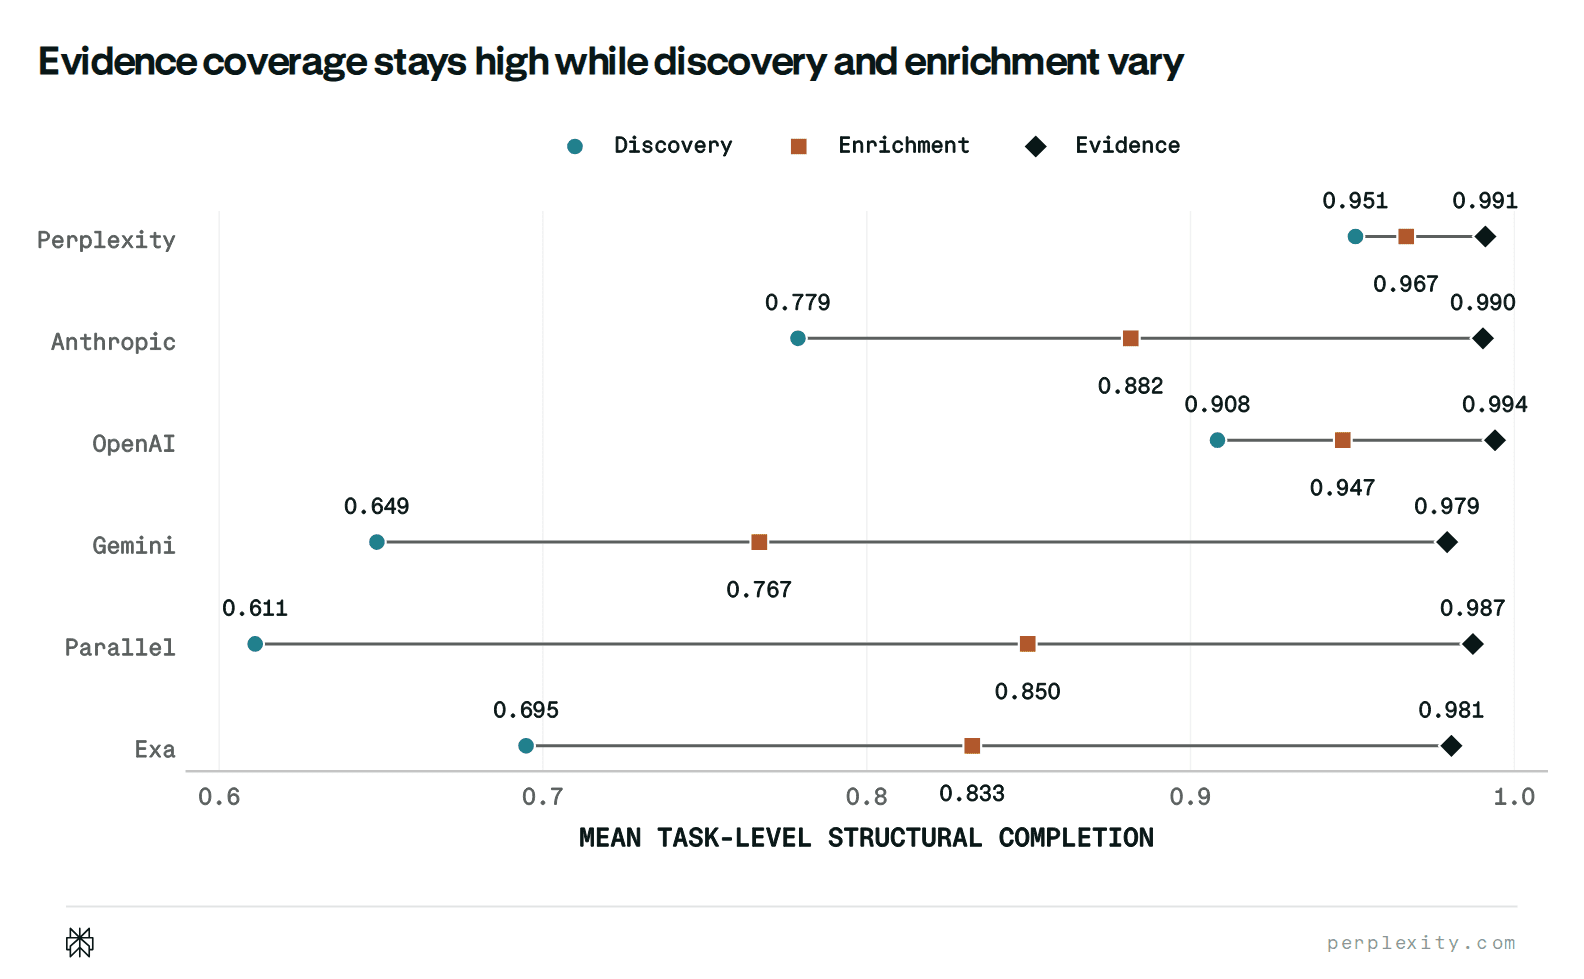
Mean task-level raw structural completion from the verifier trees. Discovery is the top key, enrichment covers intermediate keys, and evidence is the terminal key. Values use pre-collapse provided counts, so the figure isolates where submitted volume is missing before record quality is judged.
Finding a usable page is usually easy; finding complete evidence is hard. For five systems, only 3.2%–8.9% of submitted pages are unusable; OpenAI is the 23.1% outlier. Invalid or wrong-type records are also relatively uncommon at 4.2%–17.4%. The dominant losses come next: 33.6%–68.3% of submitted pages fail at least one substantive task requirement, and 57.5%–86.6% of submitted excerpts fail to support everything the record claims. Perplexity's rates are 41.4% and 57.5%. Its soft F1 falls from 0.531 under the retrieval-only check, which asks only whether the page meets every substantive requirement, to 0.363 under the full verdict, which also requires the universal checks, task-specific validity, and complete excerpt support. Hard F1 similarly falls from 0.245 to 0.133. The hard part is not just reaching a plausible page; it is turning that page into sufficient evidence for the entire claim.
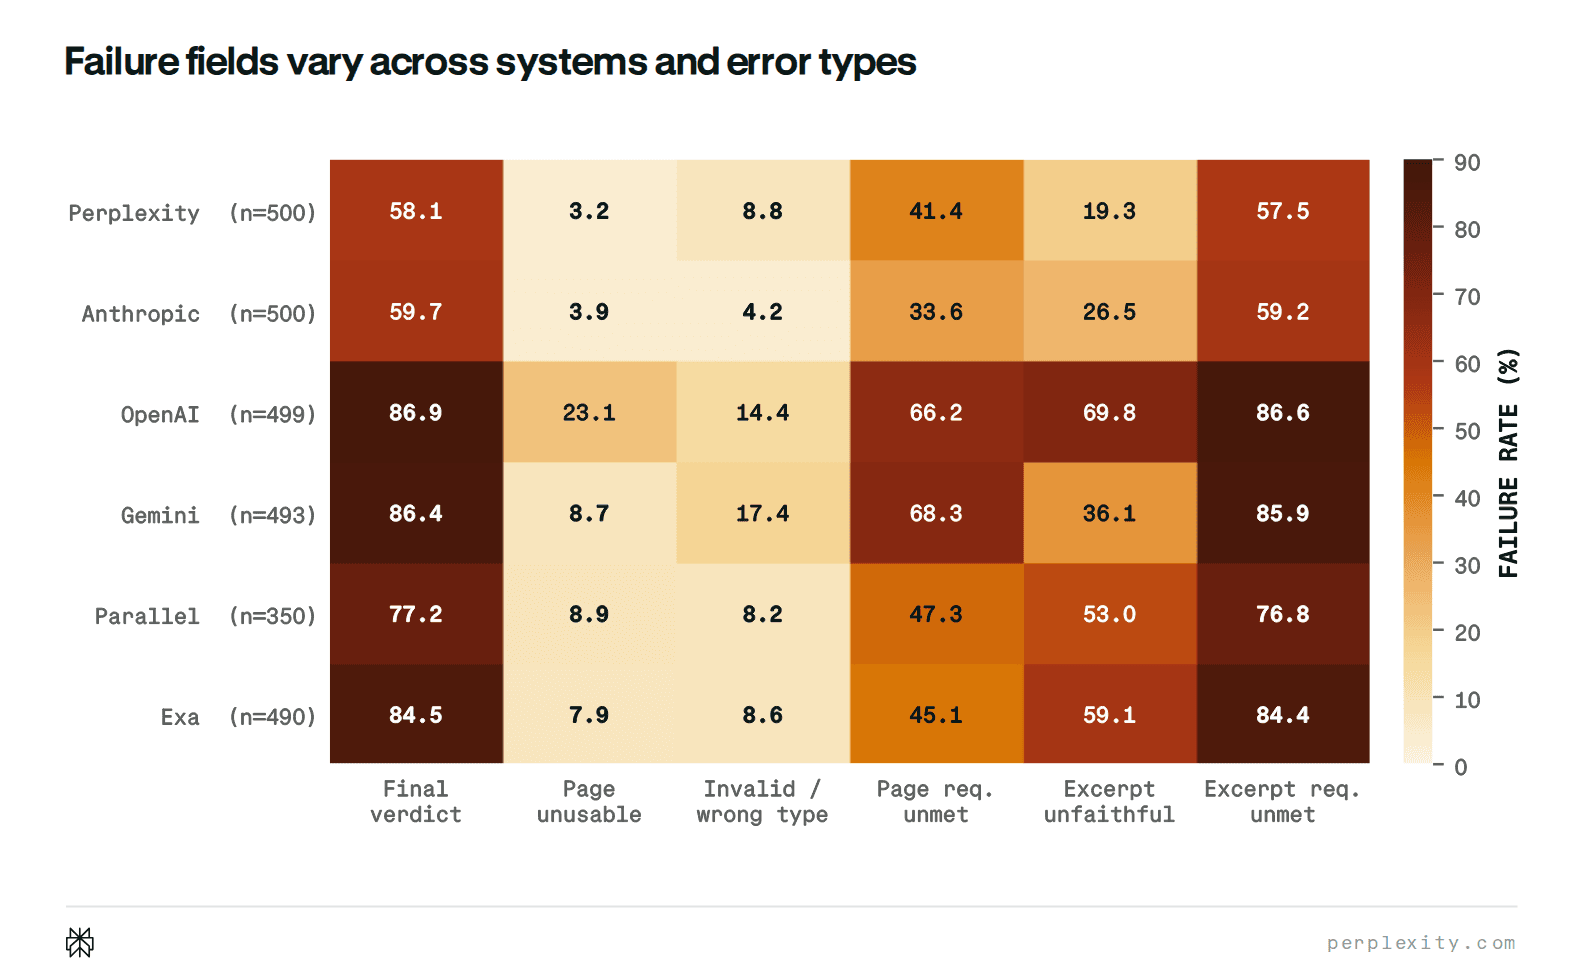
Measured record-level failure probes from available verifier details, in percent; lower is better. Failures on page and excerpt requirements are substantially more common than unusable-page or invalid-record failures. Parallel has diagnostic details for 350 tasks, while the other rows cover 490–500 tasks.
Search as Code is well matched to this task shape. A model can express retrieval, filtering, fan-out, rendering, joins, deduplication, and stopping logic as a program, while deterministic compute handles repeated operations outside the model context. That profile is consistent with Perplexity's stronger breadth retention and excerpt construction, although it does not lead at every layer: Anthropic has the lowest page-requirement failure rate.
What's next
WANDR provides more than a single leaderboard score. Its common task structure and semi-automated pipeline support varied, high-volume task generation, while per-record verdicts and hierarchy-level scores show where a run fails: discovery, enrichment, identity handling, semantic qualification, or evidence construction. The released tasks, verifier, and structural diagnostics provide a basis for improving comprehensive search systems and testing whether those gains hold at scale.
The same structure may also make WANDR useful for reinforcement learning. Rather than relying on a single sparse terminal reward, a trainer can use record- and branch-level judgments, assign partial credit for discovery and enrichment progress, and build a curriculum by raising the required counts over time. The pipeline can generate held-out sibling tasks across domains, hierarchy shapes, evidence rules, and breadth–depth settings without enumerating gold answers. This creates a path to training agents not only to find correct facts, but also to plan for coverage, detect missing branches, and recover before stopping.
The benchmark tasks, evaluation harness, and full technical report are available on GitHub.